Title
Minnesota State Grant Data
Report Type
Report Type:
Financial Aid Data & Trends
Sections
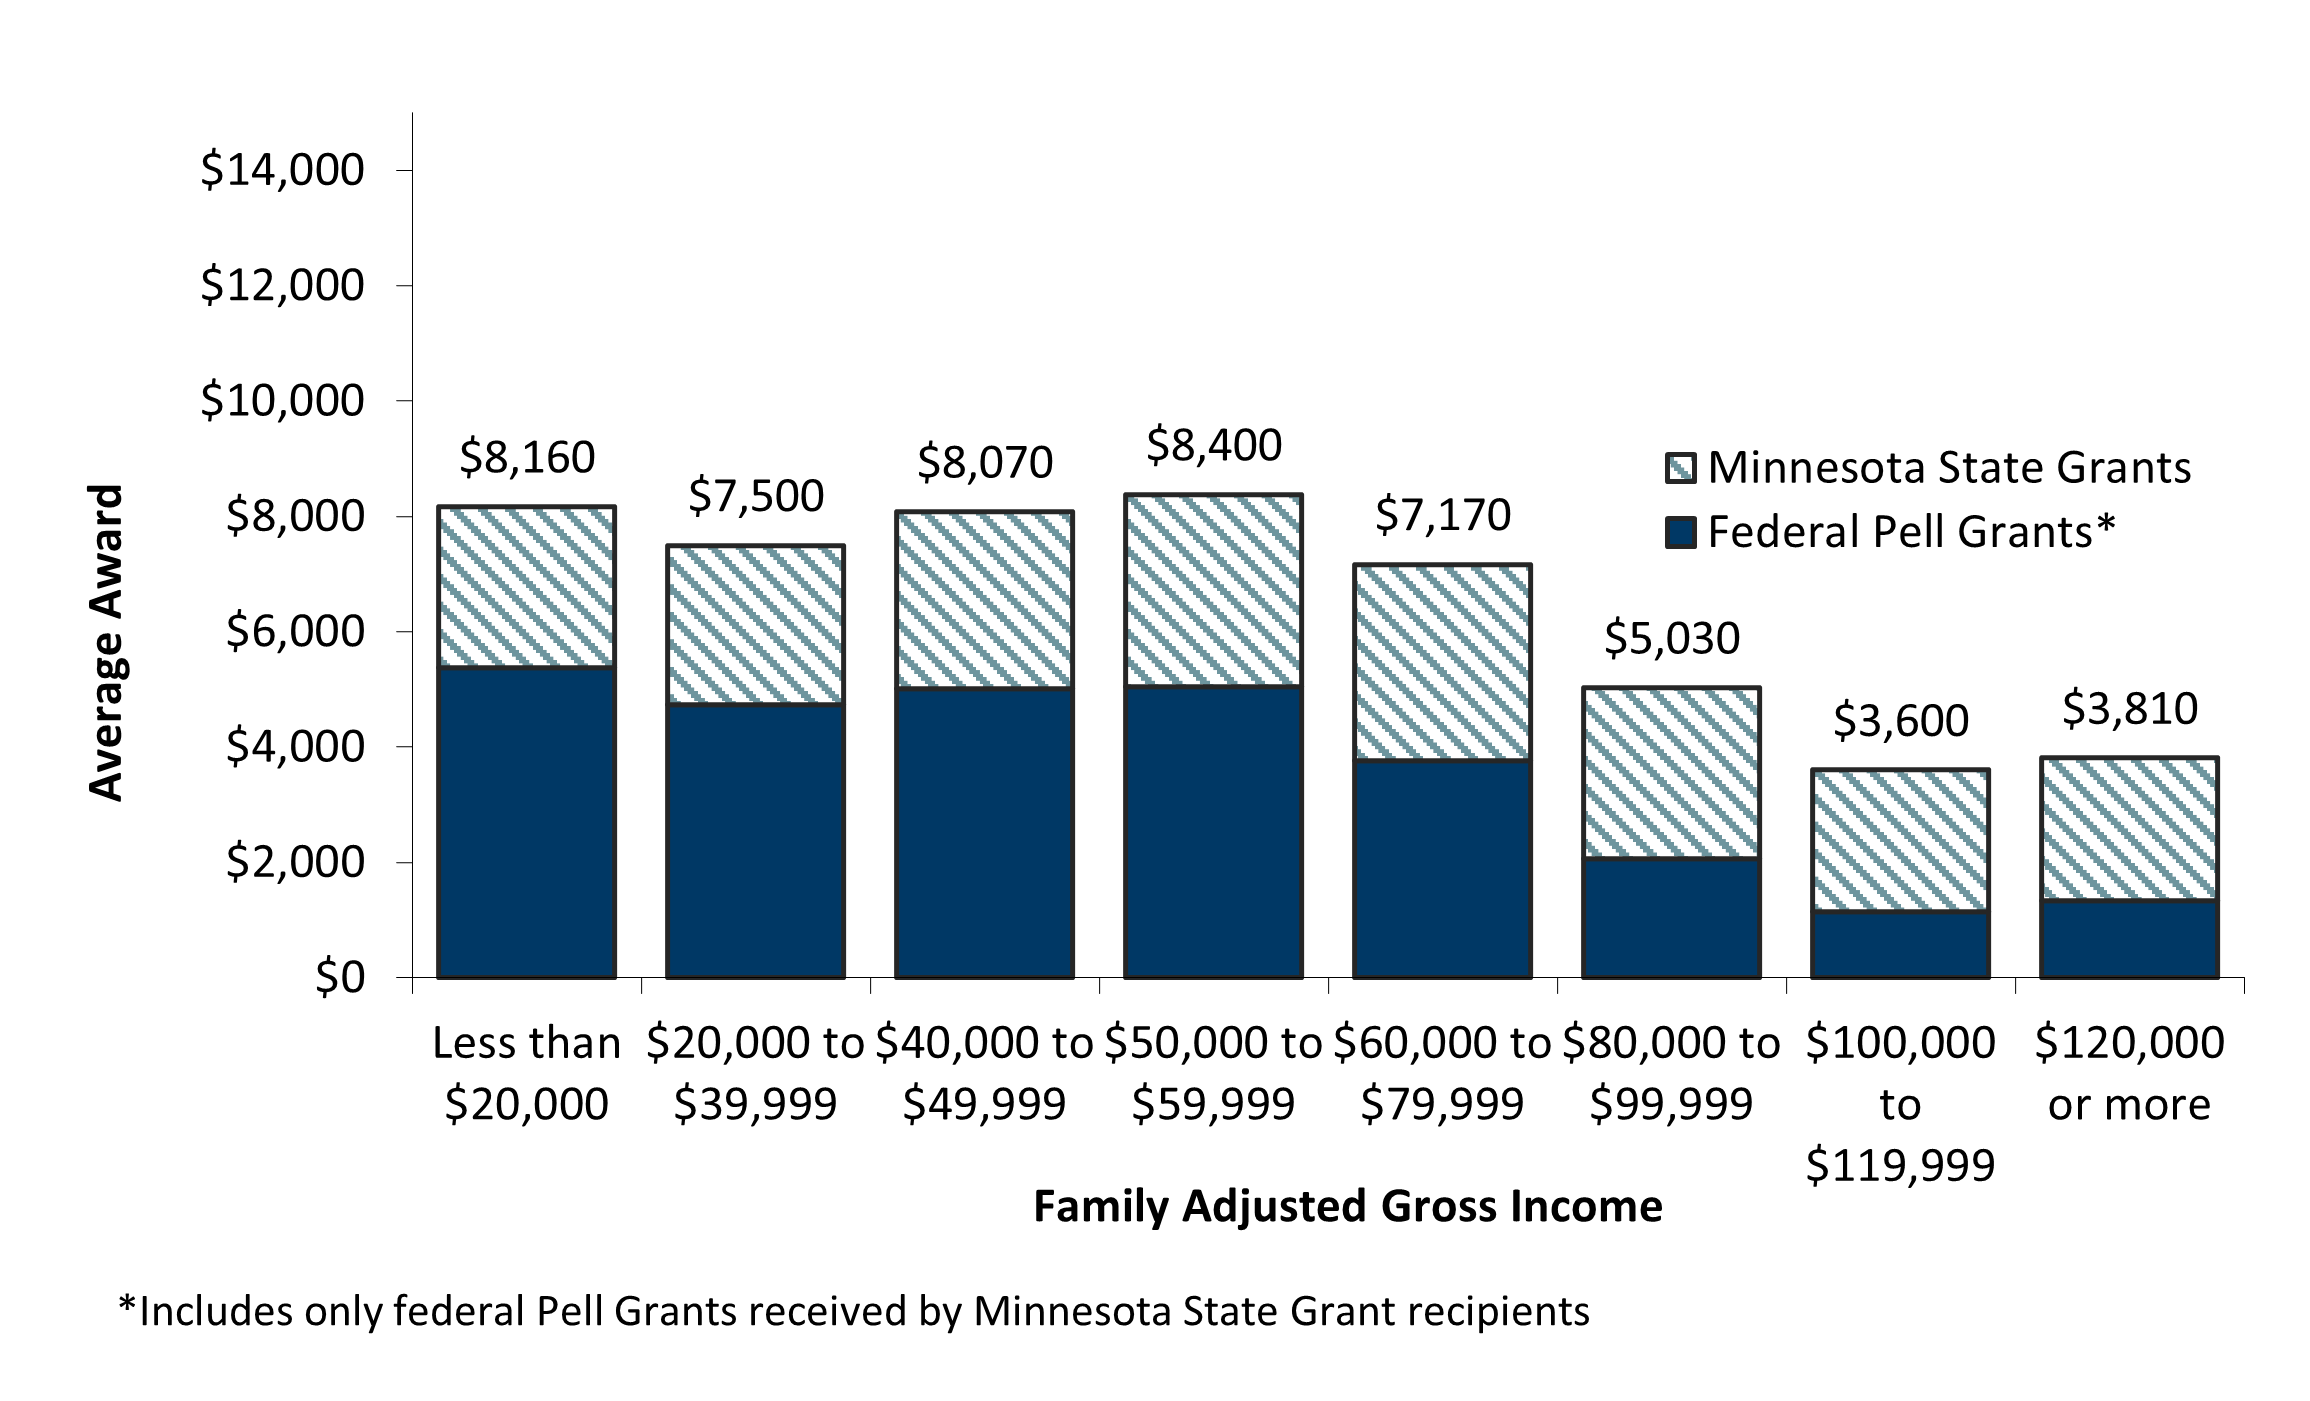
Average Combined Federal Pell and Minnesota State Grant Award Received by State Grant Recipients, Fiscal Year 2025
State Grant and Federal Pell Grant Spending Trends
The Minnesota State Grant columns are the number of Minnesota resident undergraduates receiving a state grant along with the total dollars awarded. The Federal Pell Grant columns are the number of undergraduates attending Minnesota institutions receiving a Pell Grant and total Pell Grant dollars awarded.
Note: The Minnesota State Grant Program received its first state appropriation in 1984. A Minnesota Scholarship program existed in prior years.
Minnesota State Grant & Federal Pell Grant Recipients & Awards by Year
Minnesota State Grant | Federal Pell Grant | |||
|---|---|---|---|---|
| Fiscal Year | Number of Recipients | Amount Awarded (millions) | Number of Recipients | Amount Awarded (millions) |
| 1978 | $17.41 | |||
| 1979 | $22.22 | |||
| 1980 | 32,532 | $20.60 | ||
| 1981 | 38,317 | $26.60 | ||
| 1982 | 42,881 | $26.30 | ||
| 1983 | 41,058 | $24.30 | ||
| 1984 | 52,130 | $46.30 | ||
| 1985 | 53,036 | $44.40 | ||
| 1986 | 55,858 | $45.60 | ||
| 1987 | 62,987 | $63.40 | $78.32 | |
| 1988 | 63,229 | $64.60 | ||
| 1989 | 51,569 | $55.60 | $103.98 | |
| 1990 | 46,523 | $54.70 | ||
| 1991 | 59,188 | $71.40 | $109.14 | |
| 1992 | 62,613 | $76.60 | ||
| 1993 | 62,079 | $82.62 | $122.41 | |
| 1994 | 71,801 | $91.00 | ||
| 1995 | 70,565 | $88.60 | $92.96 | |
| 1996 | 63,084 | $88.28 | ||
| 1997 | 61,523 | $89.22 | $89.58 | |
| 1998 | 60,467 | $91.43 | ||
| 1999 | 61,660 | $108.95 | $102.73 | |
| 2000 | 62,802 | $109.54 | 58,185 | $98.20 |
| 2001 | 65,246 | $115.76 | 60,806 | $111.11 |
| 2002 | 71,274 | $125.64 | 67,552 | $138.45 |
| 2003 | 72,396 | $133.59 | 74,917 | $163.10 |
| 2004 | 69,620 | $115.32 | 78,757 | $174.00 |
| 2005 | 73,410 | $124.44 | 80,806 | $177.70 |
| 2006 | 71,108 | $124.29 | 77,317 | $168.69 |
| 2007 | 80,182 | $156.10 | 78,658 | $176.92 |
| 2008 | 83,246 | $148.67 | 89,583 | $214.60 |
| 2009 | 84,518 | $143.52 | 100,329 | $269.19 |
| 2010 | 103,544 | $168.50 | 144,913 | $468.80 |
| 2011 | 88,823 | $119.89 | 181,614 | $606.16 |
| 2012 | 95,510 | $142.73 | 177,385 | $563.84 |
| 2013 | 99,440 | $161.42 | 177,217 | $551.53 |
| 2014 | 99,501 | $172.51 | 161,732 | $526.54 |
| 2015 | 99,324 | $177.03 | 150,639 | $495.28 |
| 2016 | 82,416 | $173.49 | 136,543 | $451.24 |
| 2017 | 81,023 | $187.08 | 124,428 | $407.50 |
| 2018 | 80,793 | $194.02 | 120,700 | $425.05 |
| 2019 | 79,805 | $207.70 | 117,417 | $425.52 |
| 2020 | 77,544 | $207.90 | 114,682 | $417.38 |
| 2021 | 71,889 | $200.60 | 104,276 | $388.54 |
| 2022 | 69,495 | $201.89 | 102,277 | $379.22 |
| 2023 | 67,584 | $214.14 | 99,051 | $383.89 |
| 2024 | 71,530 | $243.64 | 107,521 | $446.06 |
| 2025 | 75,742 | $222.00 | 128,967 | $594.07 |
*Historical data not currently available